1
Southern New Hampshire University (SNHU)
📋 Overview
URL: snhu.edu/request-information
Students: 165,000+ online students (largest in the U.S.)
Market Position: Aggressive digital marketing, strong brand recognition in adult education
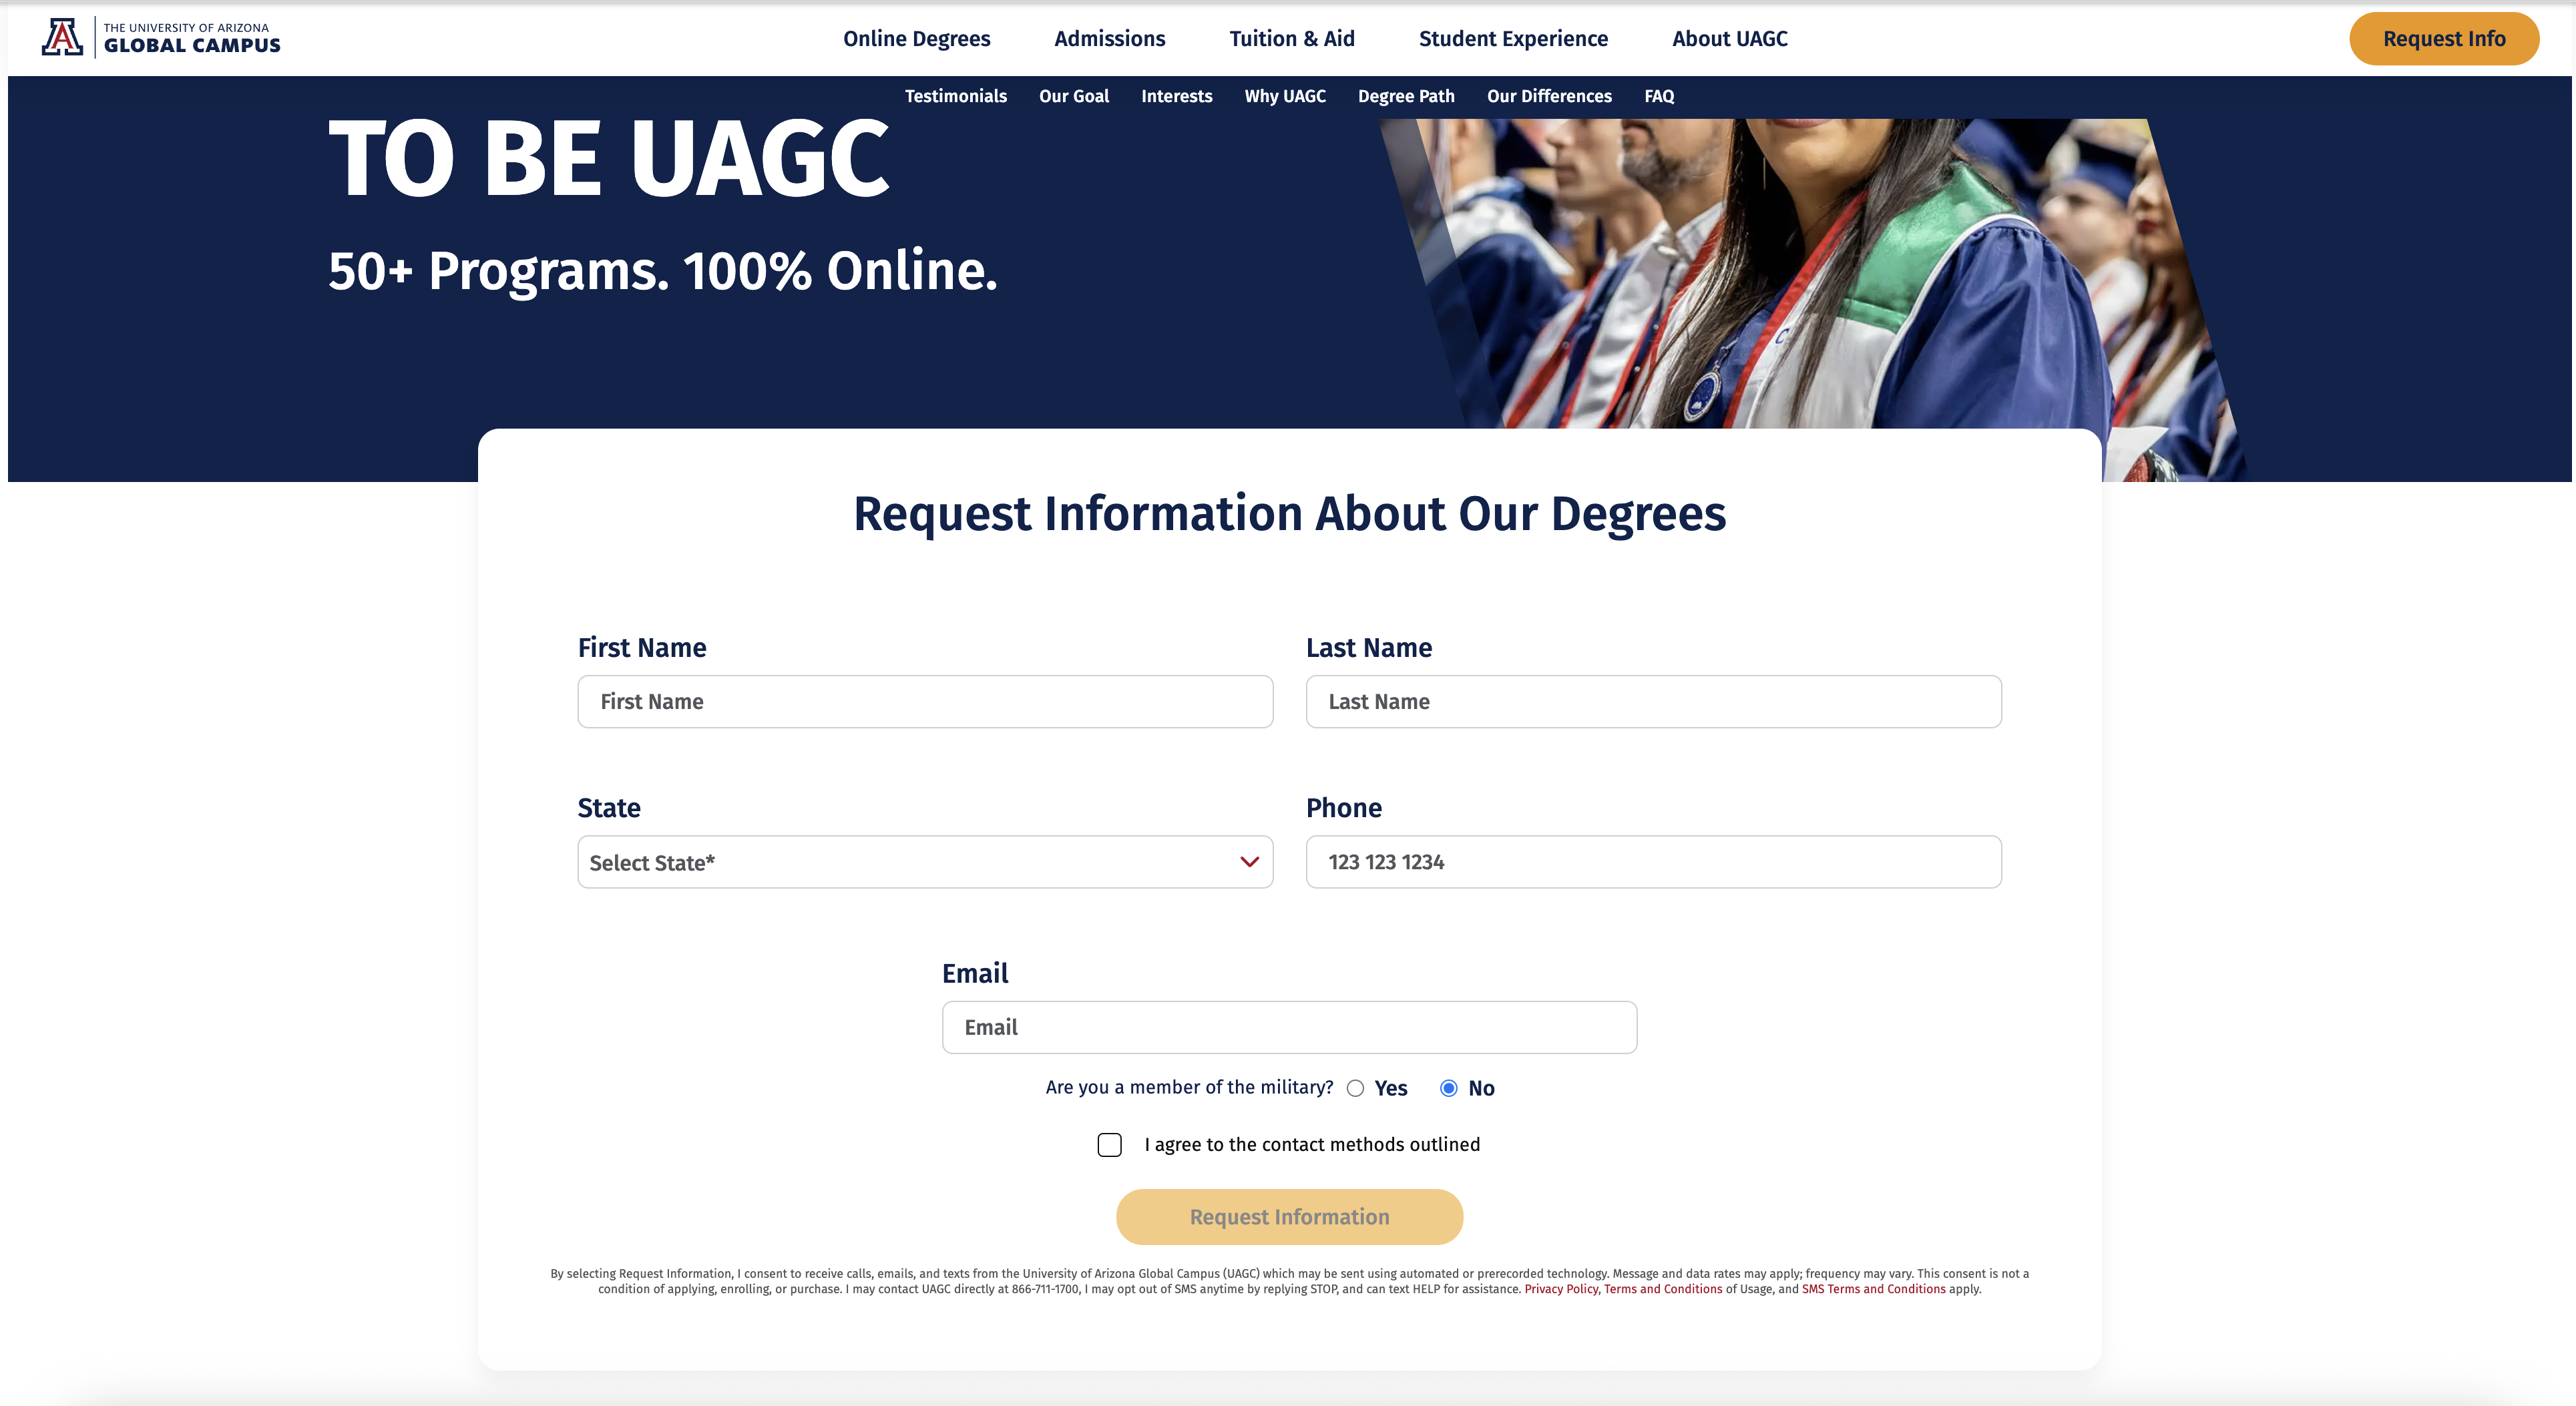
📸 SNHU RFI Form - Full View
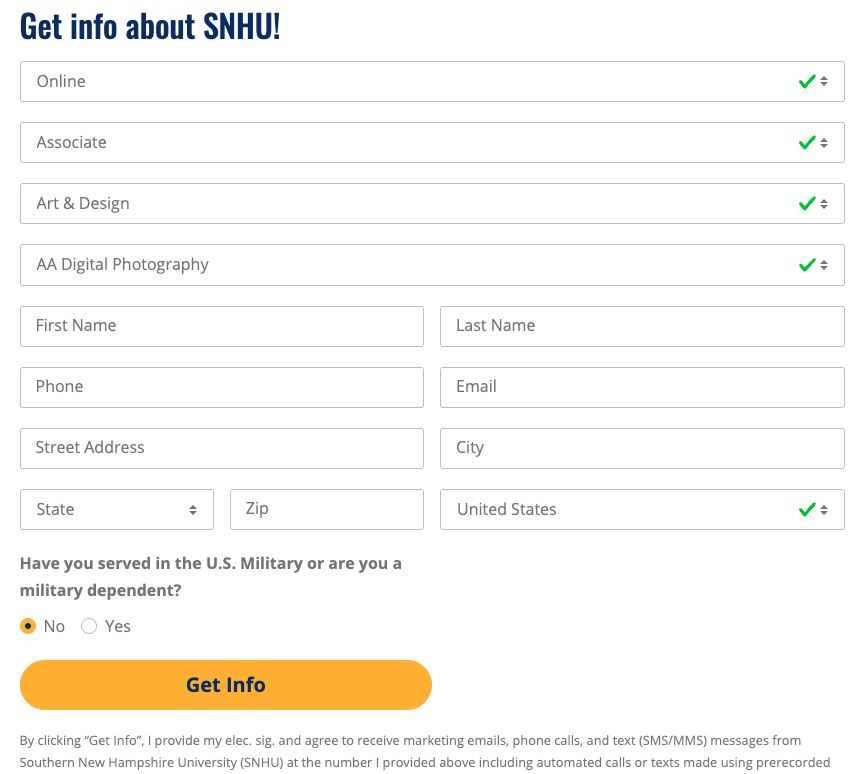
Key Features Visible: 4-level hierarchy (Attendance → Level → Area → Program), military question, full address fields, single-page layout
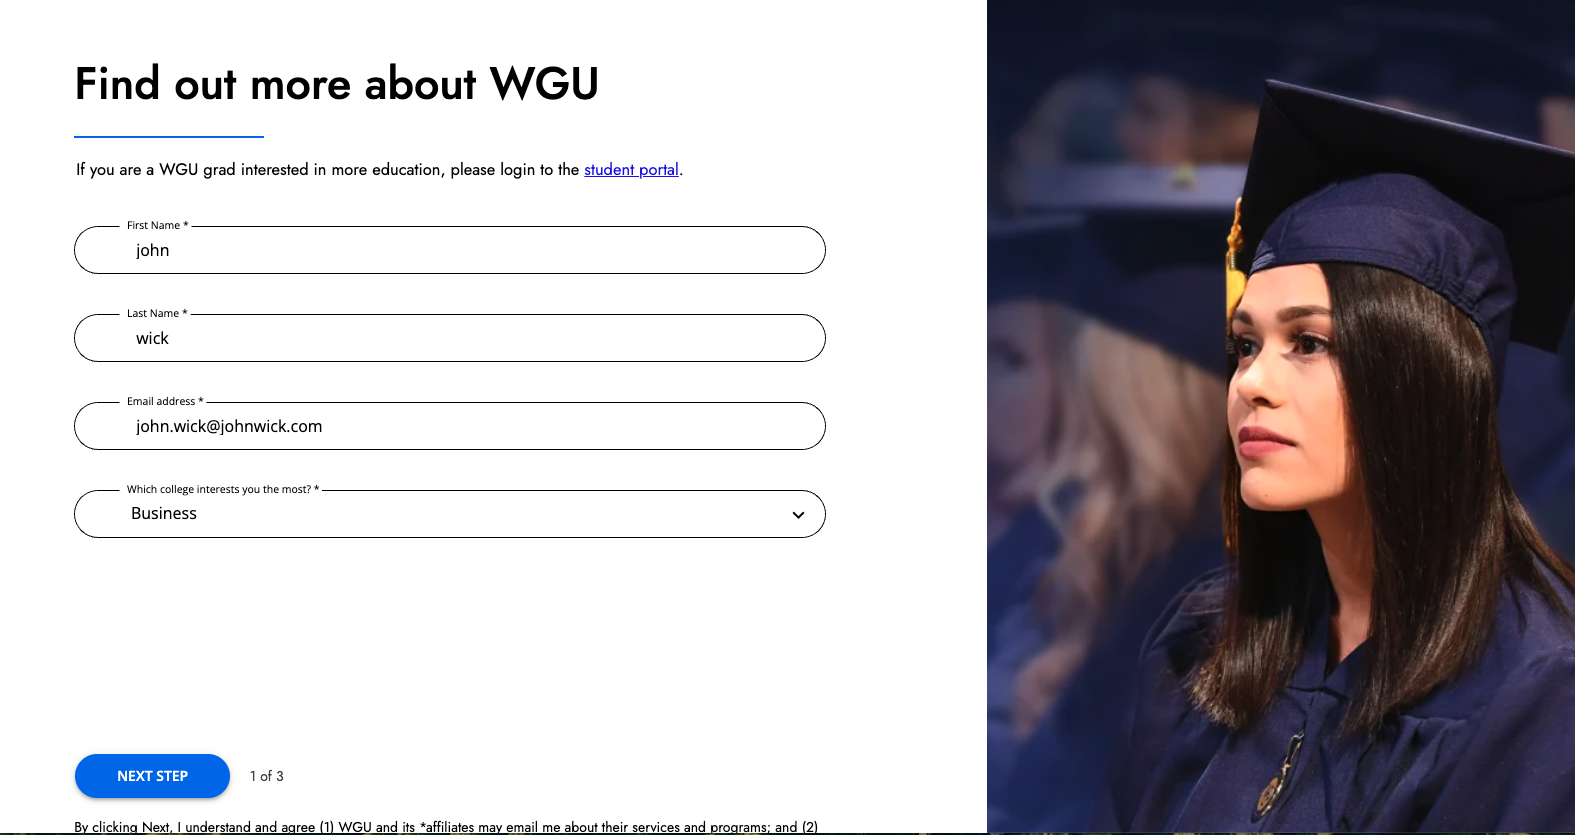
🏗️ Form Architecture
Single-page, all fields visible
Lower barrier to entry, user sees full commitment upfront
10-12 required fields
Comprehensive data capture in one interaction
Vertical single-column
Mobile-friendly, clear visual flow
None (single page)
N/A - no steps to track
🔀 Program Selection Logic
Four-Level Hierarchical Structure
Progressive filtering reduces cognitive load and improves completion rates
📊 Four-Level Hierarchical Structure
Attendance Mode → Degree Level → Area of Study → Specific Program
1. Attendance:
Online, On Campus, Hybrid
2. Level:
Associate, Bachelor, Master, Doctoral, Certificate
3. Area:
Business, Education, Health, STEM, etc.
4. Program:
Filtered list (10-30 options)
✅ Why It Works: Progressive filtering prevents overwhelming users with 200+ programs, improving completion rates.
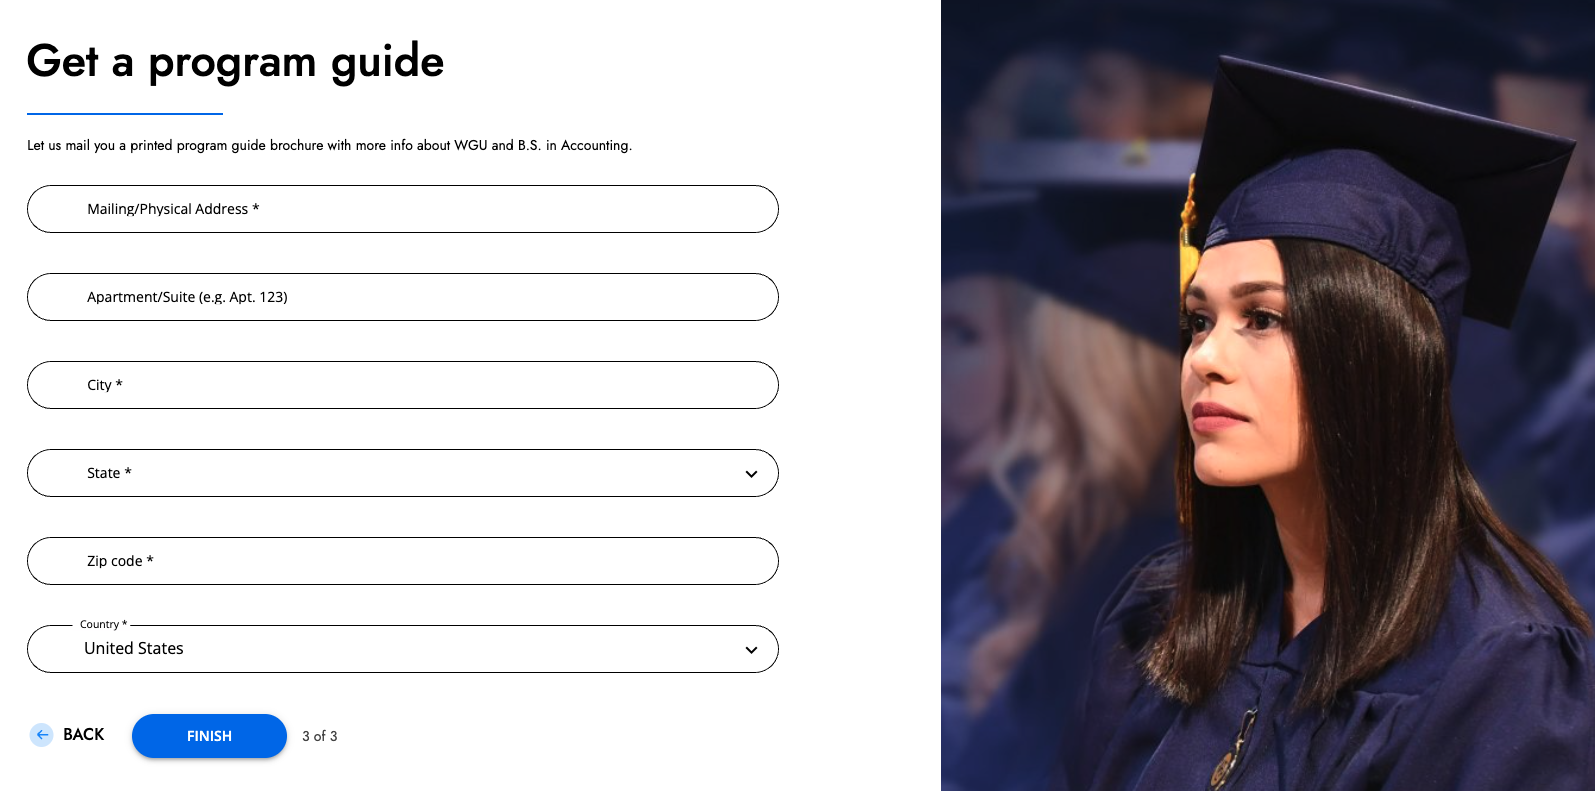
📋 Data Fields:
Name, Email, Phone, Street, City, ZIP (auto-fills State), Military (Yes/No)
📊 Notable: Full address collection (street-level) + Military status
| Street Address |
Text |
✅ Yes |
Full mailing address for materials |
| City |
Text |
✅ Yes |
Geographic data |
| State |
Auto-populated (from ZIP) |
✅ Yes |
Regulatory compliance, regional routing |
| ZIP Code |
Text (5 digits, auto-fills state) |
✅ Yes |
Demographic targeting, validates location, better UX |
| Military Status |
Radio (Yes/No) |
✅ Yes |
Benefits eligibility, specialized support |
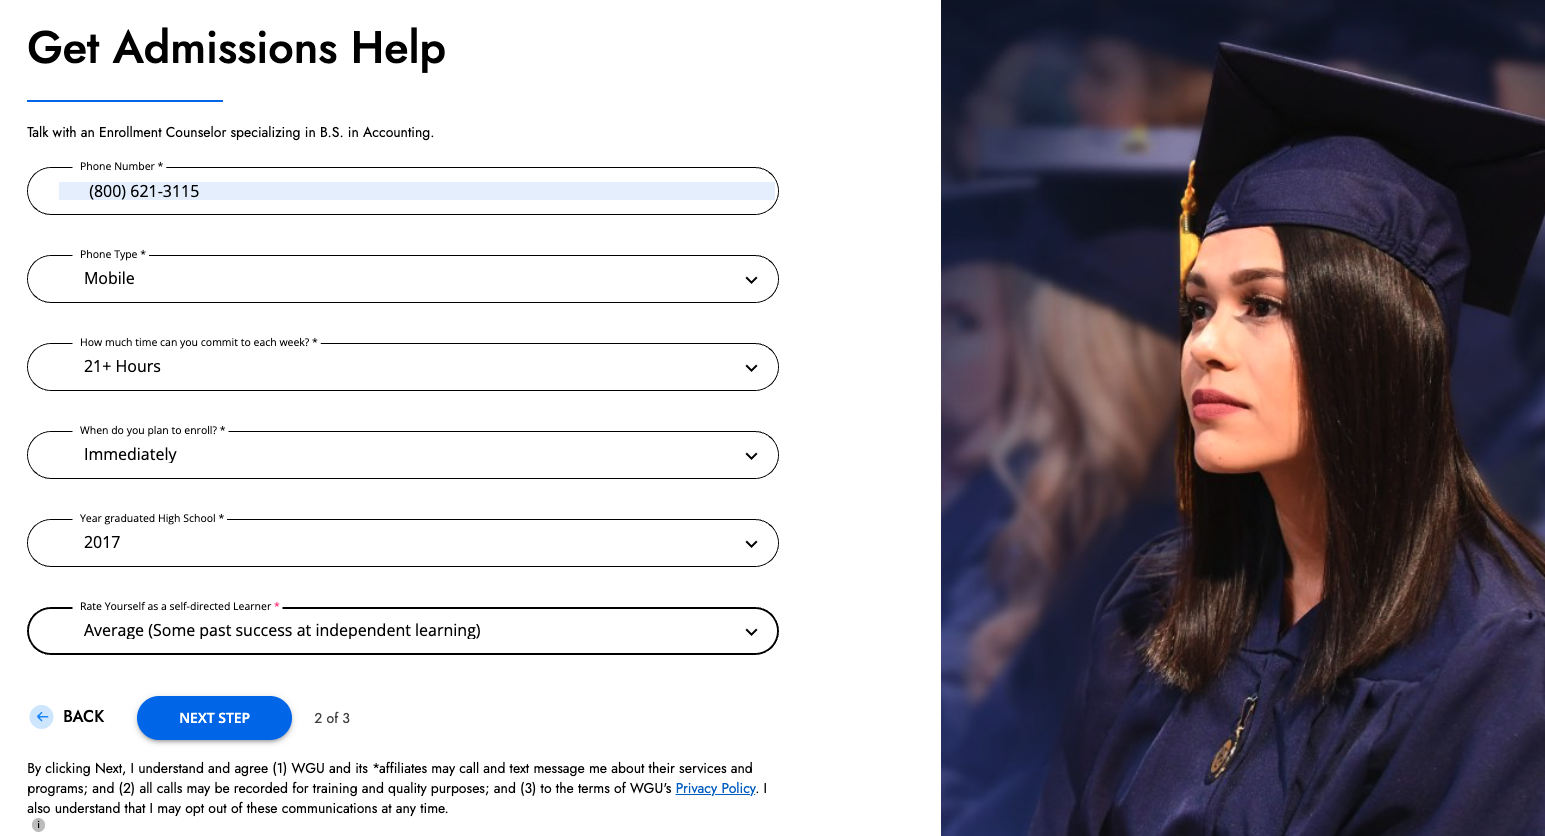
🎖️ Military Question & ✓ Consent Strategy
Format: Radio buttons (Yes/No)
"Are you affiliated with the U.S. Military?"
✅ Required field
Simple Yes/No
Impact: Standard military capture, but lacks granularity (no distinction between active/veteran/spouse)
✅ Inline Text (below submit button)
TCPA disclosure integrated into form—no popup
UAGC Note: Missing phone opt-out option may be compliance risk
📊 Analysis: Strengths & Weaknesses
✅ Adopt:
4-level hierarchy • Military status Q • Clear visual flow
⚠️ Avoid:
10-12 field count • Single-page design • Full address requirement
💡 Key Insight: SNHU's hierarchical filtering reduces cognitive load, but their 10-12 field form likely increases abandonment. Combine their filtering with a 2-step design for better results.